 Naru News日本語
Home › Glossary › Everyday science
What is an epigenetic clock that estimates body age from DNA marks?
Also called: DNA methylation clock, DNAm clock

In one minute
An epigenetic clock is a way of calculating “body age” (biological age) from blood or other samples, using the fact that the pattern of small chemical marks on DNA (methylation) changes with age.
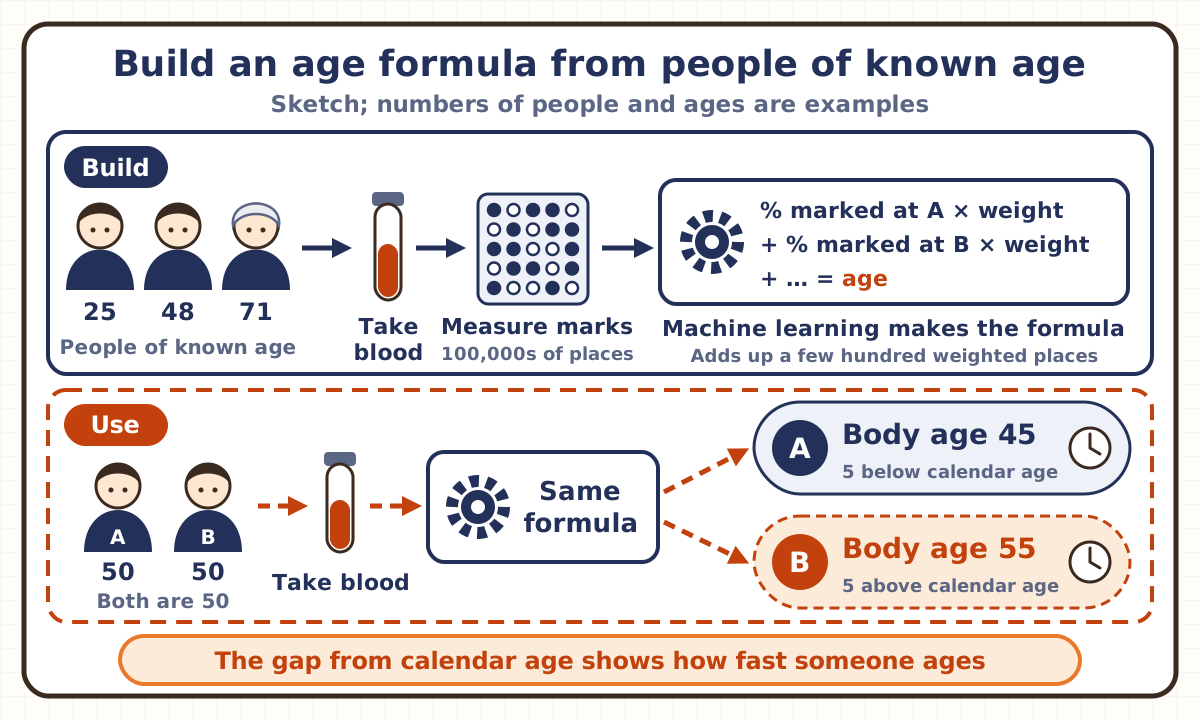
For example, two people who are both 50 may get body ages of 45 and 55 from a blood test. The marks do not change the DNA’s sequence of letters, but at certain places they become more or less common with age. Using blood and other samples from many people whose ages are known, researchers apply machine learning to build a formula that estimates age from the marks at hundreds of places.
People whose body age is higher than their real age tend to fall ill or die more often later on. But this is a link, not necessarily a cause, and it is not yet known whether lowering the number leads to a longer life.
A common mix-up
“Lower your body-age number, and you will live that much longer.”
Half right. When people of the same age are compared, those whose clock age is higher tend to have a higher rate of death later on, as several studies have found. In a 2019 paper, for example, for each year that body age was above the average for people of the same age (age since birth), the risk of death later on was about 10% higher. But this is a link; the number itself does not set how long someone lives. Cooling a thermometer to lower its reading does not mean a fever has gone down: what matters is whether the body itself changes. A 2026 paper that re-examined 51 studies of methods that might slow aging also says it is still unclear whether short-term changes in these numbers lead to long-term health, such as less disease or a longer life.
Explained in pictures
You’re free to use these figures in lessons, slides and posts if you credit Naru News (naru.news). CC BY 4.0.
Think of it like this
Guessing someone’s age from their face
When we meet someone for the first time, we look at their face and guess, “late forties, maybe.” People who have seen many faces along with their real ages get better at it, combining clues such as wrinkles, gray hair and how firm the skin is. Even so, among people who are all 50, some look younger and some look older.
An epigenetic clock works the same way. Using the DNA marks of many people of known age as clues, researchers build a formula that estimates age (the learning step), then estimate a new person’s age from the marks in their blood. The gap between the estimated age and the real age is taken as a sign of how fast that person’s body is aging.
But the comparison has limits. You can see the clues in a face, but DNA marks are invisible: machines measure hundreds of thousands of places, and the formula uses a few hundred of them. Also, makeup or hair dye can change how old someone looks without making the body any younger. In the same way, a lower clock number does not by itself mean the body has become younger. Whether it leads to less disease or a longer life has to be checked separately.
Key points
What are the “marks” on DNA?
DNA holds the information for building and running the body, written as a sequence of four kinds of letters (four kinds of building blocks, written A, T, G and C). A gene is a part of it that holds, for example, the recipe for one of the body’s parts.
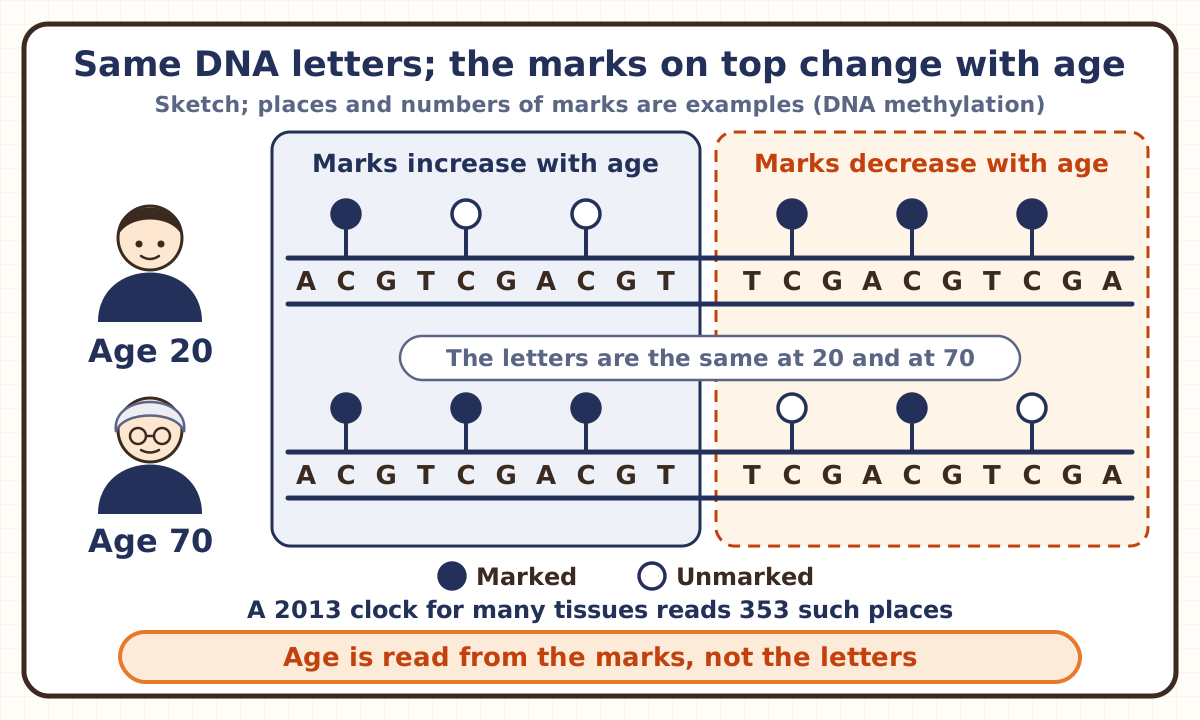
DNA methylation means that a small chemical group called a methyl group (one carbon atom with three hydrogen atoms) attaches to DNA at particular places. The mark does not change the sequence of letters. But it affects whether a gene works, and typically a gene with marks on it becomes less active.
The pattern of marks changes over a lifetime. Smoking, food and disease can also change it. And at certain places, marks become more or less common with age. These are the places an epigenetic clock reads.
Why the marks at certain places increase or decrease with age is not yet well understood. It is thought to come from influences from the surroundings received over many years, together with changes that happen by chance, building up over time.
Why is it called an “epigenetic clock”?
“Epigenetic” comes from the name of a field of research, epigenetics. Epigenetics studies how the workings of genes change without any change in the DNA’s sequence of letters, and DNA methylation is one of its main examples. The “epi-” at the front comes from Greek, and the word is sometimes explained as meaning “above genetics.” It helps to think of it as something working on top of the sequence of letters.
It is called a “clock” because the pattern of marks estimates a person’s age since birth well. The researcher who made the 2013 clock for use across many body tissues called the 353 chosen places “(epigenetic) clock” sites, and wrote that this new clock could be used to study many questions. It is also called a DNA methylation clock.
How is a clock made?
It is made with machine learning (a way of having a computer find how to get answers from many examples). First, researchers collect blood or other material taken for testing (samples) from many people whose age since birth (calendar age) is known, and measure the marks on their DNA at hundreds of thousands of places.
Even one sample holds many cells. At the same place, DNA from cells with a mark and DNA from cells without one are mixed, so what is measured at each place is the share of DNA that carries a mark (0 to 100%). Next, they have a computer pick the places that help estimate age, decide a weight for each chosen place (a number for how much that place counts), and build a formula that adds up “share × weight.”
Two clocks came out in 2013. One is a blood clock, built from the blood of 656 people. The other was built from about 8,000 samples of many tissues and cells, for use across many body tissues, and it chose 353 places.
A formula is checked on samples that were not used to build it. If it fits only the samples used to build it too closely, it can miss for new people (overfitting). The 2013 clock for many body tissues also split its data into a part for building the formula and a part for checking it.
How accurate is it?
For the 2013 clock for many body tissues, in data not used to build the formula, the median difference between the estimated age and calendar age (half the samples had a smaller difference and half a larger one) was 3.6 years. So for half the samples, the difference was more than 3.6 years. The number from a single test is an estimate with a range of several years.
It does not work equally well in every tissue. Even for this clock, estimates tended to be off in tissues such as breast, heart and muscle. And a 2022 report found that measuring the same sample twice, with small variations in measurement, gave differences of up to 9 years for widely used clocks. The same report also showed clocks rebuilt so that the number wobbles less when measured again, and with them most differences were within 1.5 years.
Interestingly, when this clock measured iPS cells (cells that can become many kinds of cells) remade from body cells, their age came out close to zero. Remaking the cells sets the clock back to zero. ES cells, made from cells taken just after a fertilized egg starts to grow, also came out close to zero.
Is it a problem if your body age is higher than your real age?
In research, the gap between body age and calendar age is linked to the risk of disease and death. But this is a link; it does not mean the gap is causing disease. If something such as smoking affects both the gap and disease, a link can show up on its own.
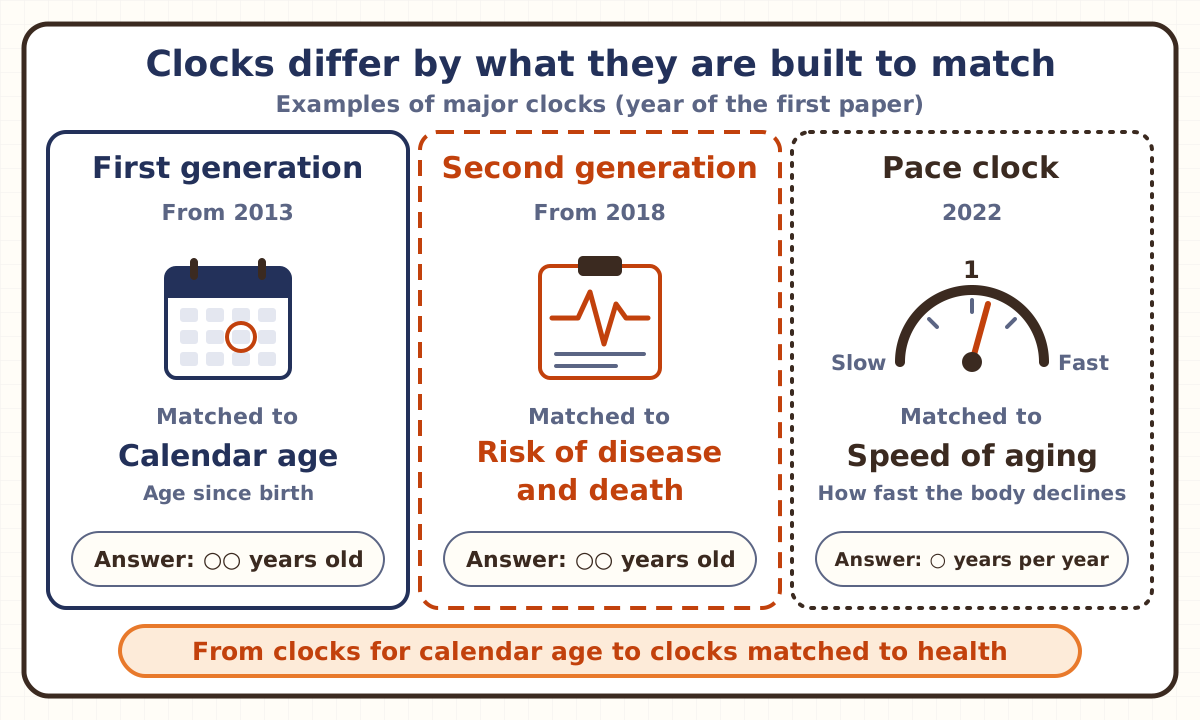
So clocks built to match health rather than calendar age (called the second generation) appeared. The 2018 clock first created an age that reflects health from blood-test values chosen for how well they predict death (such as blood sugar and the strength of inflammation) plus calendar age, and then built a formula that estimates it from DNA marks. Among people of the same age, those higher on this clock were more likely to die later on.
The 2019 clock uses DNA marks to estimate the amounts of several proteins in the blood and how much a person has smoked, and combines them to match the time until death. For each year this clock’s age was above the average for people of the same age, the risk of death later on was about 10% higher.
The 2022 clock is a clock for the speed of aging. Researchers checked about 1,000 people born around the same time in the same town in New Zealand four times, from age 26 to 45, and used values for many of the body’s workings, such as the heart, lungs, kidneys and teeth, to find how fast the body was declining. They then built a formula that estimates this from DNA marks in blood taken at 45. An answer of 1 means aging one year per calendar year, the average; above 1 means faster. People with a faster pace tended to fall ill, become disabled or die more often later on.
Can body age be lowered?
Research on lowering it is moving ahead, but even if it goes down, it is not yet known whether that means less disease or a longer life. A 2026 paper gathered data from 51 studies (clinical trials and others; a clinical trial is a study that tests new treatments and the like in people) in which people tried methods that might slow aging, and re-examined them all the same way. Using blood taken before and after, it calculated 16 clocks plus 94 other measures (values estimated from DNA marks, such as how much a person has smoked, used as clues to why a clock’s number changed), and compared each person before and after.
Looking at the 16 clocks together, body age clearly went down in 19 of the 51 studies (when many comparisons are made, some differences show up just by chance; allowing for that, 13). In 5 studies it went up instead, and in most of the rest there was no clear change. By kind of method, the ones that clearly lowered it were prescription drugs (such as diabetes drugs) and lifestyle changes such as exercise and diet, with drugs lowering it more. Supplements and medical procedures (such as organ transplants), taken as groups, did not clearly lower it.
By kind of clock, clocks built to match the risk of death or the pace of aging showed the biggest changes between before and after, while the 2013 clocks went up or down here and there. And for many clocks, body age went down more in studies of people with a disease than in studies of healthy people.
But this paper, too, says it is still unclear whether short-term changes in the numbers lead to long-term health, such as less disease or a longer life. What it compared were the same people’s numbers before and after, and there is not yet a guide to how much a clock number must change to matter for the body. Also, the authors include employees of a company that developed a clock, and people named on a clock patent, and the paper says so in the section where authors list their financial and work ties. Such ties can tilt how results are read, so they are declared for readers to know.
Check yourself
Q1An epigenetic clock examines DNA taken from blood or other samples to estimate body age. At each particular place on the DNA, what value does the clock read?
Answer and explanation
Answer: C The share of DNA where a certain letter carries a small mark
At each particular place on the DNA, the clock reads the share of DNA that carries a mark (methylation), from 0 to 100%. Blood holds many cells, so at the same place, DNA with a mark and DNA without one are mixed. The mark is a small chemical group called a methyl group (one carbon atom with three hydrogen atoms), and it does not change the order of the DNA’s letters (A, T, G, C). The clock is not counting DNA in which letters were swapped or dropped.
Q2Among epigenetic clocks, what were the “second generation” clocks that came out in 2018 and 2019 built to estimate?
Answer and explanation
Answer: B Risk of disease and death
The first clocks, from 2013, were built to estimate age since birth (calendar age). A clock that estimates calendar age across many body tissues had already been made in 2013. The clock that estimates how fast a person ages came later, in 2022. The 2018 paper says that using calendar age alone as the target can leave out marks that do not change clearly with age but may reflect differences in health. So the 2018 clock was built to match an age made from blood-test values chosen for how well they predict death, and the 2019 clock to match the time until death.
More on this → Key points: Is it a problem if your body age is higher than your real age?
Q3A 2026 paper re-examined 51 studies in which people tried methods that might slow aging. Comparing before and after, which kinds of methods clearly lowered body age as estimated by epigenetic clocks?
Answer and explanation
Answer: A Prescription drugs, and exercise or diet
Looking at the 16 clocks together, body age clearly went down in 19 of the 51 studies (13 after allowing for differences that show up by chance). By kind of method, the ones that clearly lowered it were prescription drugs and lifestyle changes such as exercise and diet, with drugs lowering it more. Supplements and medical procedures (such as organ transplants), taken as groups, did not clearly lower it. But whether a lower number means less disease or a longer life is not yet known.
Related terms
- Machine learning
- Overfitting
- DNA methylation
- Epigenetics
- Biological age
- Gene
- Aging
- Telomere
- iPS cell
- Clinical trial
Sources and how we checked
- Horvath, “DNA methylation age of human tissues and cell types” (University of California, Los Angeles; Genome Biology 14, R115, 2013; abstract and Results [how the 353 sites were chosen, the 193 that gain and 160 that lose marks with age, 82 datasets, 51 tissues and cell types, about 8,000 samples, training and test data, the median error of 3.6 years in test data, ages near zero for ES and iPS cells and the clock being reset to zero when iPS cells are made, poorly calibrated tissues] and the passage naming the “clock CpGs”; full text on Europe PMC [PMC4015143], read November 16, 2026)
- Hannum et al., “Genome-wide methylation profiles reveal quantitative views of human aging rates” (University of California, San Diego and others; Molecular Cell 49(2), pp. 359–367, January 2013; abstract [whole blood of 656 people aged 19 to 101, more than 450,000 sites], Methods [methylation recorded as a fraction between 0 and 1 across the blood cells] and Discussion [the mechanisms behind age-related changes are not well understood and are attributed to environmental exposure over time and spontaneous change]; full text on PMC [PMC3780611], read November 16, 2026)
- Levine et al., “An epigenetic biomarker of aging for lifespan and healthspan” (University of California, Los Angeles and others; Aging 10(4), pp. 573–591, April 2018; abstract, Results [nine blood-test values and calendar age chosen with a mortality model, 513 sites, about 4.5% higher mortality risk per year independent of calendar age] and the weakness of clocks trained on calendar age; full text on Europe PMC [PMC5940111], read November 16, 2026)
- Lu et al., “DNA methylation GrimAge strongly predicts lifespan and healthspan” (University of California, Los Angeles and others; Aging 11(2), pp. 303–327, January 2019; abstract and Results [estimates of seven plasma proteins and smoking pack-years, time to death, 1,030 sites, hazard ratio of about 1.10 per year]; full text on Europe PMC [PMC6366976], read November 16, 2026)
- Belsky et al., “DunedinPACE, a DNA methylation biomarker of the pace of aging” (Columbia University, Duke University and others; eLife 11, e73420, January 2022; abstract, Results [1,037 people in Dunedin, 19 measures at ages 26, 32, 38 and 45, blood at age 45, 173 sites, 1 as the average pace, links to disease, disability and death] and why such measures are called “clocks”; full text on Europe PMC [PMC8853656], read November 16, 2026)
- Higgins-Chen et al., “A computational solution for bolstering reliability of epigenetic clocks” (Yale University and others; Nature Aging 2(7), pp. 644–661, July 2022; abstract [up to 9 years’ difference between replicates for six major clocks, mostly within 1.5 years after the fix]; read on Europe PMC on November 16, 2026)
- Sehgal et al., “Responsiveness of epigenetic aging biomarkers to longevity interventions in humans” (Yale University and others; Nature Medicine 32(9), pp. 3477–3490, September 2026, online August 21, 2026; abstract, Results [51 studies and 3,128 samples, 16 clocks and 94 other measures, 19 significant decreases, 13 after correction, 5 increases and 26 without significant change, the four categories (medical procedures such as organ transplants) and that only drugs and lifestyle significantly lowered epigenetic age, differences by clock generation, examples of the 94 other measures (such as estimated pack-years of smoking), and larger decreases for many clocks in studies of people with disease], Discussion [unclear whether short-term changes mean long-term health, no minimal clinically important difference] and competing interests; full text on Europe PMC [PMC13577923], read November 16, 2026)
- Yale University, “Can you slow the aging process? Study reveals which interventions might help” (YaleNews, August 21, 2026; the drugs and lifestyle changes that lowered epigenetic age, supplements and some medical procedures that did not, newer clocks doing better, larger changes in people with disease, and the researchers’ cautions; read November 16, 2026)
- ScienceDaily, “Yale scientists reveal what really slows aging and what doesn’t” (a Yale University release, November 13, 2026; that changes in biological-age markers have not yet been shown to mean longer life or fewer age-related diseases; read November 16, 2026)
- National Human Genome Research Institute (NHGRI), “Epigenomics Fact Sheet” (updated August 16, 2020; methyl groups attached to DNA as chemical tags, marks that do not change the DNA sequence, turning genes on or off, and changes over a lifetime and with smoking, diet and disease; read November 16, 2026)
- National Human Genome Research Institute (NHGRI), “Epigenetics” (Talking Glossary of Genomic and Genetic Terms; the definition as a field studying changes in DNA that do not alter the sequence; read November 16, 2026)
- US Centers for Disease Control and Prevention (CDC), “Epigenetics, Health, and Disease” (January 31, 2025; that epigenetic changes do not change the DNA sequence, that methylation typically turns genes off, and that epigenetics changes throughout life; read November 16, 2026)
- Gen Suisse, “Epigenetics” (an explainer by a Swiss organization that informs the public about genetic research; the word comes from Greek and literally means “above genetics”; read November 16, 2026)
- Japan Foundation for Aging and Health, Kenko Choju Net, “Biological time in the genome” (in Japanese; July 12, 2017, updated December 2, 2022; for the Japanese name of the epigenetic clock and the mention of telomere shortening; read November 16, 2026)
- Tohoku University and Japan Agency for Medical Research and Development (AMED), press release on a new index for estimating mortality risk (in Japanese; June 18, 2026; only the background section, for the Japanese name “epigenetic clock” and the note that most such clocks stopped at estimating calendar age; read November 16, 2026)
AI wrote this page from the sources above, and a different AI checked it against the text of those sources (November 16, 2026). A person with a master’s degree in science and a Japanese high-school science teaching license also read and checked it before publishing. Numbers are as of that date. If anything was hard to follow, you spot a mistake, or there’s a term you’d like explained, please write to [email protected].
Everyday science terms
- Dark oxygen
- You are hereEpigenetic clock
- Glymphatic system
- Human embryo model
- iPS cell
- Manganese nodule
- Moore’s law
- Stem cell